介绍
通常情况下,每个应用可以承载的压力都是固定的,我们可以通过提前进行压测来了解单应用程序副本的负载能力。如果在业务高峰,或者业务的请求压力增加时候,对应用进行横向扩容可以保证更好的为用户提供服务。
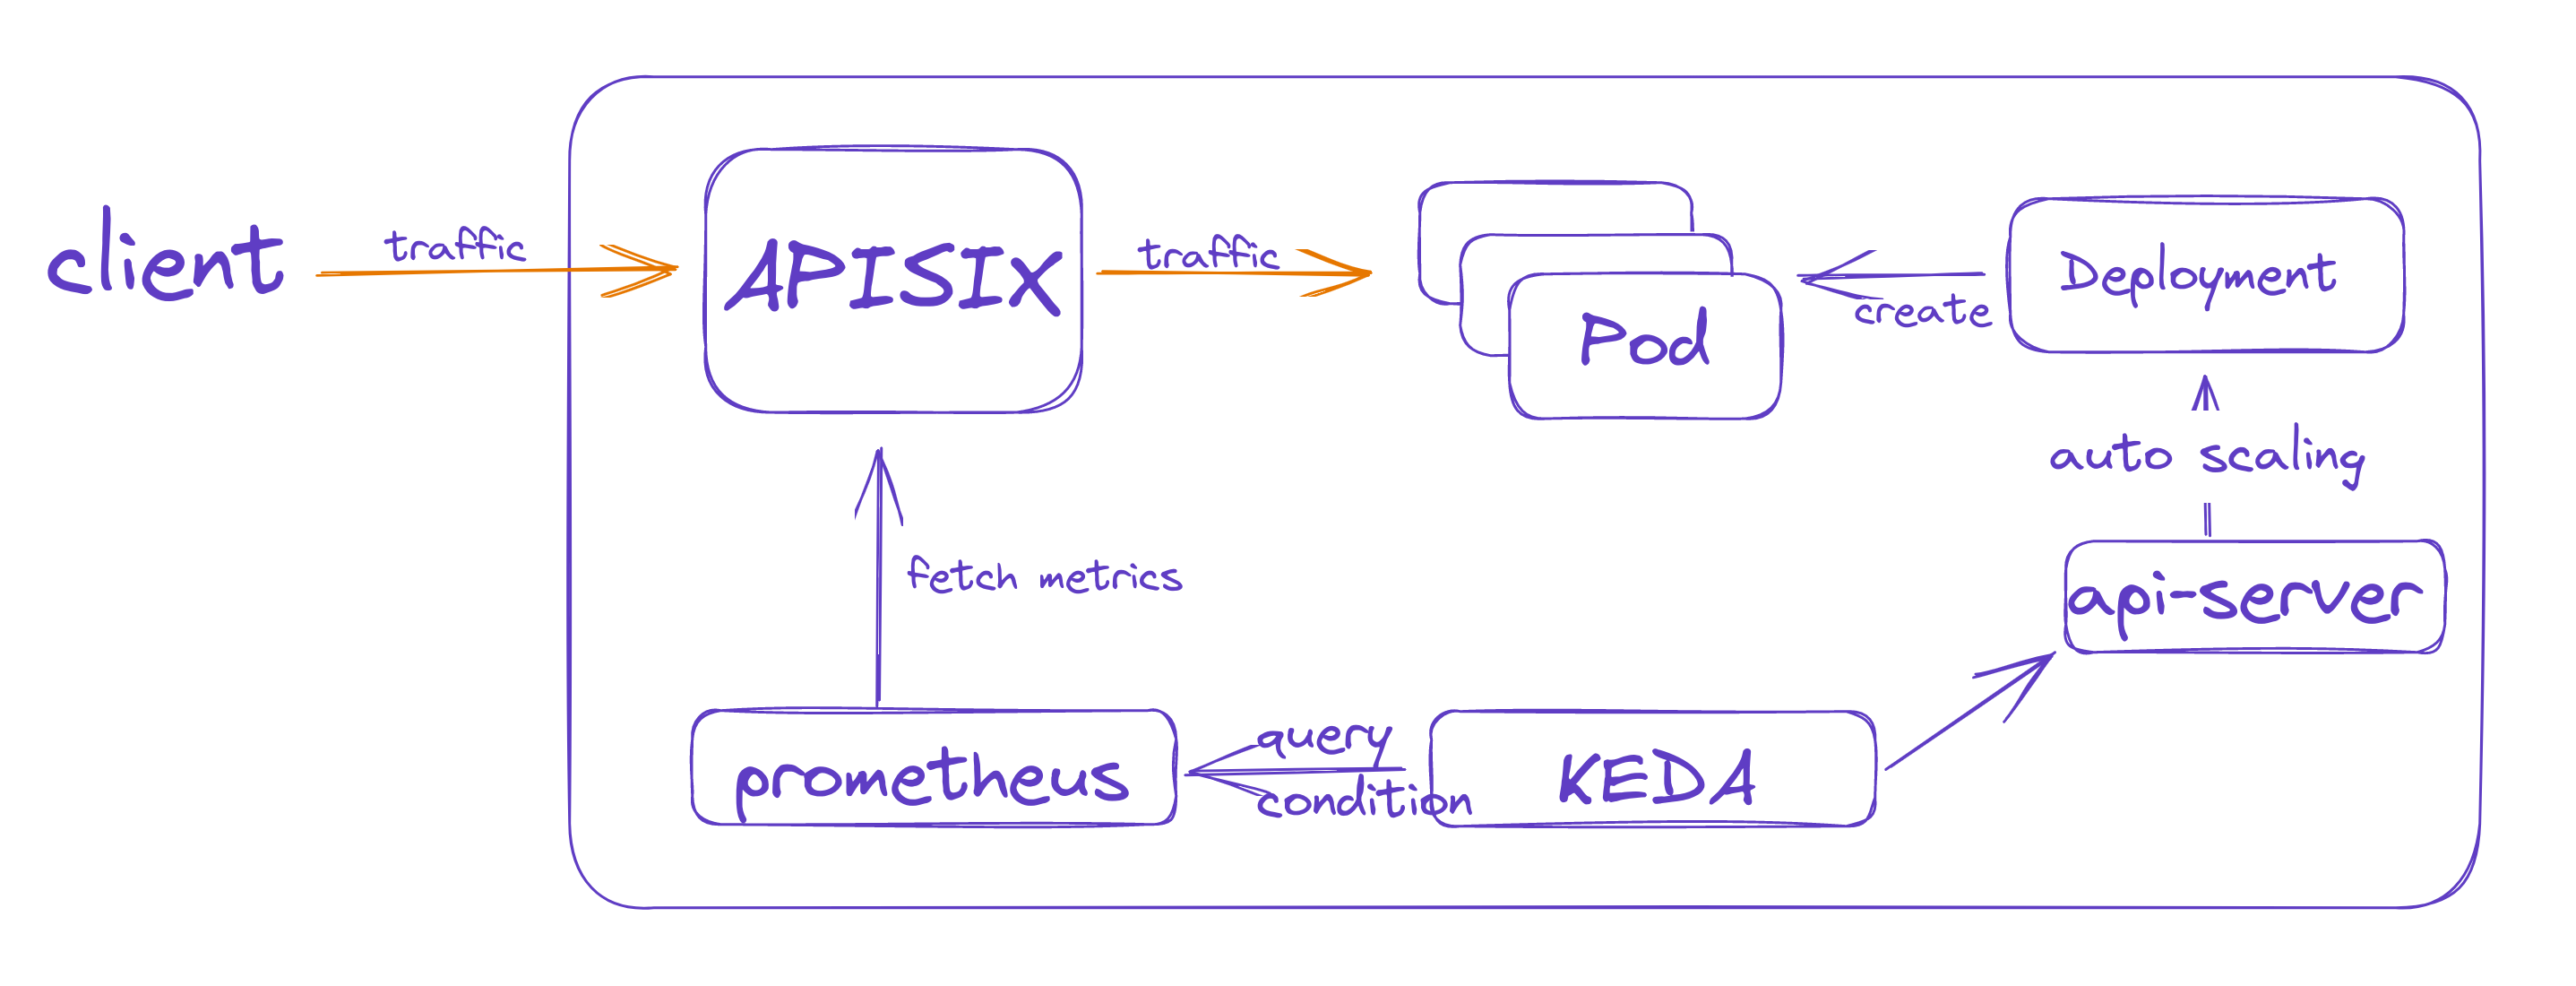
Apache APISIX 是一个高性能的云原生 API 网关,所有发送到上游应用程序的流量都将通过 APISIX,所以我们可以根据 APISIX 提供的流量指标,来判断应用程序是否需要进行弹性伸缩。
本文中将使用 KEDA 作为弹性伸缩的控制组件,用 Prometheus 采集 APISIX 提供的流量指标来进行应用的弹性伸缩。
KEDA 中如何使用 Prometheus 实现伸缩
KEDA 是一个 Kubernetes 中基于事件的自动伸缩组件,可以配置多种伸缩器。本文将使用 Prometheus 作为伸缩器 ,获取 APISIX 暴露出来的 metrics(指标)并进行应用程序的扩缩容。
部署 KEDA
KEDA 的部署比较简单,添加对应的 Helm repo 并进行安装即可。
1(MoeLove) ➜ helm repo add kedacore https://kedacore.github.io/charts
2"kedacore" has been added to your repositories
3(MoeLove) ➜ helm repo update kedacore
4Hang tight while we grab the latest from your chart repositories...
5...Successfully got an update from the "kedacore" chart repository
6Update Complete. ⎈Happy Helming!⎈
7(MoeLove) ➜ helm install keda kedacore/keda --namespace keda --create-namespace
8NAME: keda
9LAST DEPLOYED: Thu Jan 19 00:01:00 2023
10NAMESPACE: keda
11STATUS: deployed
12REVISION: 1
13TEST SUITE: None
在安装完成后,Pod 处于 Running 状态,表示已经正常安装。
1(MoeLove) ➜ kubectl -n keda get pods
2NAME                                               READY   STATUS    RESTARTS   AGE
3keda-operator-metrics-apiserver-6d4db7dcff-ck9qg   1/1     Running   0          36s
4keda-operator-5dd4748dcd-k8jjz                     1/1     Running   0          36s
接下来部署 Prometheus。
部署 Prometheus
此处我们使用 Prometheus Operator 来进行 Prometheus 的部署。Prometheus Operator 可以帮助我们在 Kubernetes 中快速部署 Prometheus 实例,以及通过声明式配置的方式添加监控规则。
通过如下步骤完成 Prometheus Operator 的安装。
1(MoeLove) ➜ https://github.com/prometheus-operator/prometheus-operator/releases/download/v0.62.0/bundle.yaml
2(MoeLove) ➜ kubectl apply --server-side -f bundle.yaml
3customresourcedefinition.apiextensions.k8s.io/alertmanagerconfigs.monitoring.coreos.com serverside-applied
4customresourcedefinition.apiextensions.k8s.io/alertmanagers.monitoring.coreos.com serverside-applied
5customresourcedefinition.apiextensions.k8s.io/podmonitors.monitoring.coreos.com serverside-applied
6customresourcedefinition.apiextensions.k8s.io/probes.monitoring.coreos.com serverside-applied
7customresourcedefinition.apiextensions.k8s.io/prometheuses.monitoring.coreos.com serverside-applied
8customresourcedefinition.apiextensions.k8s.io/prometheusrules.monitoring.coreos.com serverside-applied
9customresourcedefinition.apiextensions.k8s.io/servicemonitors.monitoring.coreos.com serverside-applied
10customresourcedefinition.apiextensions.k8s.io/thanosrulers.monitoring.coreos.com serverside-applied
11clusterrolebinding.rbac.authorization.k8s.io/prometheus-operator serverside-applied
12clusterrole.rbac.authorization.k8s.io/prometheus-operator serverside-applied
13deployment.apps/prometheus-operator serverside-applied
14serviceaccount/prometheus-operator serverside-applied
15service/prometheus-operator serverside-applied
然后使用如下配置作为 Prometheus 实例的配置,然后将其应用到 Kubernetes 集群中。
1---
2apiVersion: v1
3kind: ServiceAccount
4metadata:
5  name: prometheus
6---
7apiVersion: rbac.authorization.k8s.io/v1
8kind: ClusterRole
9metadata:
10  name: prometheus
11rules:
12- apiGroups: [""]
13  resources:
14  - nodes
15  - nodes/metrics
16  - services
17  - endpoints
18  - pods
19  verbs: ["get", "list", "watch"]
20- apiGroups: [""]
21  resources:
22  - configmaps
23  verbs: ["get"]
24- apiGroups:
25  - networking.k8s.io
26  resources:
27  - ingresses
28  verbs: ["get", "list", "watch"]
29- nonResourceURLs: ["/metrics"]
30  verbs: ["get"]
31---
32apiVersion: rbac.authorization.k8s.io/v1
33kind: ClusterRoleBinding
34metadata:
35  name: prometheus
36roleRef:
37  apiGroup: rbac.authorization.k8s.io
38  kind: ClusterRole
39  name: prometheus
40subjects:
41- kind: ServiceAccount
42  name: prometheus
43  namespace: default
44---
45apiVersion: monitoring.coreos.com/v1
46kind: Prometheus
47metadata:
48  name: prometheus
49spec:
50  serviceAccountName: prometheus
51  serviceMonitorSelector:
52    matchLabels:
53      app: apisix
54  serviceMonitorNamespaceSelector:
55    matchLabels:
56      team: apisix
57  resources:
58    requests:
59      memory: 400Mi
60  enableAdminAPI: false
61---
62apiVersion: v1
63kind: Service
64metadata:
65  name: prometheus
66spec:
67  type: LoadBalancer
68  ports:
69  - name: web
70    port: 9090
71    protocol: TCP
72    targetPort: web
73  selector:
74    prometheus: prometheus
应用后,则可以看到在 default namespace 下创建了 Prometheus 实例。由于上述配置中创建了 LoadBalancer 类型的 Service,所以可以直接通过 LoadBalancer 的公网 IP 进行 Prometheus 的访问。
1(MoeLove) ➜ kubectl get svc
2NAME                  TYPE           CLUSTER-IP      EXTERNAL-IP    PORT(S)          AGE
3kubernetes            ClusterIP      10.43.0.1       <none>         443/TCP          96m
4prometheus-operator   ClusterIP      None            <none>         8080/TCP         92m
5prometheus-operated   ClusterIP      None            <none>         9090/TCP         41m
6prometheus            LoadBalancer   10.43.125.194   216.6.66.66    9090:30099/TCP   41m
如何部署网关并开启监控
接下来部署 APISIX Ingress,并使用 Prometheus 进行 metrics 采集。
如果用户没有使用 APISIX Ingress,而是仅仅使用了 APISIX,操作方法也是类似的。 这里不再分开介绍。
此处使用 Helm 进行部署,可以同时将 APISIX Ingress controller 和 APISIX 部署到集群中。
1(MoeLove) ➜ helm repo add apisix https://charts.apiseven.com
2"apisix" already exists with the same configuration, skipping
3(MoeLove) ➜ helm repo update apisix
4Hang tight while we grab the latest from your chart repositories...
5...Successfully got an update from the "apisix" chart repository
6Update Complete. ⎈Happy Helming!⎈
7(MoeLove) ➜ helm upgrade --install apisix apisix/apisix --create-namespace  --namespace apisix --set gateway.type=LoadBalancer --set ingress-controller.enabled=true --set ingress-controller.config.apisix.serviceNamespace=apisix
8Release "apisix" has been upgraded. Happy Helming!
9NAME: apisix
10LAST DEPLOYED: Thu Jan 19 02:11:23 2023
11NAMESPACE: apisix
12STATUS: deployed
13REVISION: 1
14TEST SUITE: None
15NOTES:
161. Get the application URL by running these commands:
17     NOTE: It may take a few minutes for the LoadBalancer IP to be available.
18           You can watch the status of by running 'kubectl get --namespace apisix svc -w apisix-gateway'
19  export SERVICE_IP=$(kubectl get svc --namespace apisix apisix-gateway --template "{{ range (index .status.loadBalancer.ingress 0) }}{{.}}{{ end }}")
20  echo http://$SERVICE_IP:80
接下来开启 APISIX 的 prometheus 插件,具体的配置方法和相关参数可以参考如下两篇文档。
- prometheus plugins | Apache APISIX®
- How to access Apache APISIX Prometheus metrics on Kubernetes | Apache APISIX®
开启后,便可以通过创建 ServiceMonitor 资源,让 Prometheus 抓取 APISIX 暴露出的 metrics 了。
1apiVersion: monitoring.coreos.com/v1
2kind: ServiceMonitor
3metadata:
4  name: example-app
5  labels:
6    app: apisix
7spec:
8  selector:
9    matchLabels:
10      app: apisix
11  endpoints:
12  - port: web
验证应用弹性伸缩能力
此处将创建一个示例应用。
1(MoeLove) ➜ kubectl create deploy httpbin --image=kennethreitz/httpbin --port=80
2deployment.apps/httpbin created
3(MoeLove) ➜ kubectl expose deploy httpbin --port 80
创建如下路由规则,应用到 Kubernetes 集群后,则可通过 APISIX 进行请求的代理。
1apiVersion: apisix.apache.org/v2
2kind: ApisixRoute
3metadata:
4  name: httpserver-route
5spec:
6  http:
7  - name: rule1
8    match:
9      hosts:
10      - local.httpbin.org
11      paths:
12      - /*
13    backends:
14       - serviceName: httpbin
15         servicePort: 80
接下来,创建 KEDA 的 ScaledObject,配置 Prometheus 相关参数。
1apiVersion: keda.sh/v1alpha1
2kind: ScaledObject
3metadata:
4  name: prometheus-scaledobject
5  namespace: default
6spec:
7  scaleTargetRef:
8    name: httpbin
9  triggers:
10  - type: prometheus
11    metadata:
12      serverAddress: http://prometheus.default.svc:9090
13      metricName: apisix_http_status
14      threshold: '10'
15      query: sum(rate(apisix_http_status{route="httpserver-route"}[1m]))
上述参数表示通过 sum(rate(apisix_http_status{route="httpserver-route"}[1m])) 作为查询表达式,如果结果能到达 10, 则开始进行扩容(此处配置仅用于本文中的示例使用,生产环境请按照实际情况进行修改)。
然后,我们通过 curl 向 httpbin 服务发出连续请求,再次查看示例应用的 Pod 已经变成两个,证明 KEDA 成功自动扩容了。
1(MoeLove) ➜ kubectl get pods
2NAME                      READY   STATUS    RESTARTS   AGE
3httpbin-d46d778d7-chtdw   1/1     Running   0          12m
4httpbin-d46d778d7-xanbj   1/1     Running   0          10s
待一段时间无请求后,再次查看发现 Pod 的数量自动缩减为一个,证明自动缩容也实现了。
1(MoeLove) ➜ kubectl get pods
2NAME                      READY   STATUS    RESTARTS   AGE
3httpbin-d46d778d7-chtdw   1/1     Running   0          32m
总结
本篇文章利用 KEDA 使用 Prometheus 采集 APISIX 暴露出来的指标作为伸缩器,进而实现基于流量的应用程序弹性伸缩。由于所有流量都会先经过 APISIX ,所以在 APISIX 侧进行数据统计更加简单方便。
在业务请求量上来后,应用程序将进行自动化的扩容,当业务低谷的时候,则会自动的缩容。这可以在缓解很多生产环境下的手动扩/缩容操作,以保障用户的服务体验。